Review again your experiment on ''THE 03: Converting Electrical into Heat '' or ''THE 02: Building Material''. Then:
- Rewrite again the graph.
- Give the details. (Hint)
- Use good analysis & grammar
- Structure:
- Paragraph 1 : General
- Paragraph 2 : Detail
- Paragraph 3 : Detail
Example :

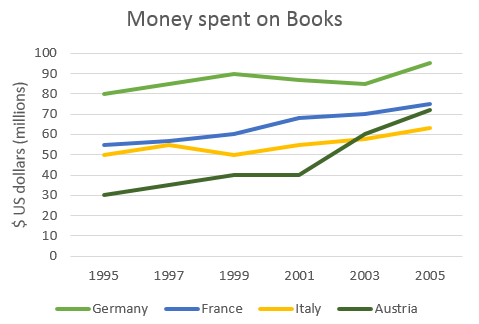
The line graph compares the amount of money spent on buying
books in Germany, France, Italy and Austria over a period of ten years between 1995
and 2005.
In 1995 Austria spent the
...........
amount of money on books, while Italy and France spent about as
........... as each other. However,
by 2001, the gap in spending between these two countries had widened and considerably
........... money was spent in France
than In Italy.
As can be seen from the graph, the amount of money spent increased in all four countries
but rose the most
........... in
Austria. The period between 2000 and 2005 saw a
........... growth and in 2005 the
Austrians spent
........... as much
money as they did in 1995.
However, during this ten-year period, Germany remained the
........... spenders on book, with
all three other countries spending much
........... on them.